
The Yield Curve Explained: The Simple Line That Predicts Recessions
The yield curve is a single line on a chart that has predicted nearly every US recession for decades — and when it does something unusual, economists around the world hold their breath. It sounds like an intimidating piece of financial jargon, but the idea behind it is remarkably simple, and once you understand it, you will have one of the most powerful early-warning signals in all of economics at your fingertips.
Today we explain what the yield curve is, why its normal shape makes intuitive sense, what happens when it flips upside down, and why that flip has such an eerie track record of warning about trouble ahead. We will build it all from simple, everyday logic.
Starting with one simple question
The yield curve grows out of a single, intuitive question: if you lend money for longer, should you earn more?
Think about lending money to a friend. If they ask to borrow $100 for one month, you might not worry much. But if they ask to borrow it for ten years, you would naturally want more in return. Why? Because a lot can happen in ten years — they could lose their job, move away, or run into trouble. Your money is tied up and exposed to risk for far longer. So it makes sense to charge more for a longer loan.
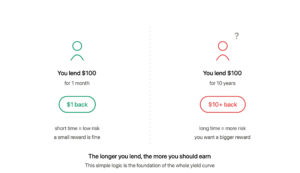
This same logic applies to bonds, which we covered in Bonds Explained. Normally, a bond that lasts thirty years pays a higher yield than one that lasts two years, because lenders want extra reward for locking their money away for longer and taking on more uncertainty.
What the yield curve actually shows
The yield curve is simply a chart that plots the yields of bonds across different lengths of time, from short-term to long-term, usually for government bonds.
On the bottom of the chart, you have time — from very short bonds (a few months) on the left to very long bonds (ten, twenty, thirty years) on the right. Going up the side, you have the yield each bond pays. Draw a line connecting them, and that line is the yield curve.
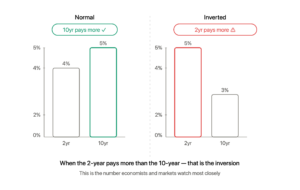
In normal, healthy times, the line slopes gently upward from left to right. Short-term bonds pay less; long-term bonds pay more. This upward slope is exactly what our friend-lending logic predicts, and it is the sign of a normally functioning economy.
The normal upward curve: a healthy economy
When the yield curve slopes up in the usual way, it tells a reassuring story. Investors are being paid more to lend for longer, just as they should be. They expect the economy to keep growing, they expect normal or rising interest rates in the future, and they are comfortable committing money for the long term at a modest premium.
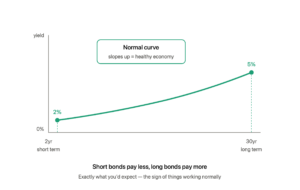
This upward-sloping curve is the backdrop to most periods of economic expansion. It is the shape that says, quietly, “things are working as they should.” Nobody pays much attention to the yield curve when it looks like this — which is exactly why its normal shape matters as a baseline.
The inverted curve: the warning sign
Now here is where it gets fascinating. Sometimes the yield curve flips upside down. Short-term bonds start paying more than long-term bonds. The line slopes downward. This is called an inverted yield curve, and it is one of the most watched warning signs in economics.
Why would this strange thing ever happen? It means investors expect interest rates to fall in the future — and rates usually fall when the economy weakens and the central bank cuts them to help. So an inverted curve reveals that big investors collectively expect trouble ahead: slower growth, or even a recession, that will force the central bank to lower rates.
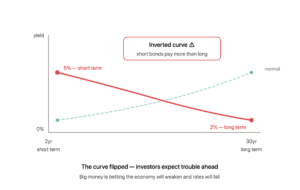
In other words, when the curve inverts, the smartest money in the world is quietly betting that the economy is heading for a downturn. That collective expectation shows up as the strange, upside-down shape.
Why the inversion predicts recessions so well
The remarkable thing about the inverted yield curve is its track record. An inversion has preceded nearly every US recession over the past several decades, usually by a period of months to a couple of years. Few economic indicators can claim anything close to that record.
There are two ways to understand why. The first is simply that it reflects expectations: when enough sophisticated investors expect a downturn, they act on it, and their combined actions bend the curve. It is a giant, real-time poll of what the financial world truly expects.
The second is that the inversion can actually help cause a slowdown. When short-term rates are higher than long-term rates, lending becomes less profitable for banks, so they lend less. Less lending means less spending and investment, which slows the economy. The warning can become partly self-fulfilling.
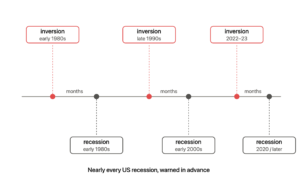
Either way, an inverted curve is a signal worth respecting — though it is not a perfect crystal ball, and the timing between an inversion and any downturn can vary widely.
How to read the yield curve in the news
When you hear commentators discussing the yield curve, they are usually comparing two specific bonds — often the two-year and the ten-year government bonds. When the shorter one yields more than the longer one, the curve is inverted, and that is what triggers the recession talk.
A few practical notes keep this useful rather than alarming. An inversion is a warning, not a guarantee, and downturns can arrive many months later or, occasionally, not clearly at all. The curve can also flip back to normal before a recession actually happens. And crucially, the yield curve is one signal among many, not a lone oracle. Wise readers treat it as an important voice in the conversation, not the final word.
Why this matters to you
You do not trade bonds, so why should you care about the shape of a line on a chart? Because that line is one of the clearest available previews of where the economy may be heading.
When the yield curve inverts and stays inverted, it is a sign to pay attention: businesses may grow cautious, hiring may slow, and central banks may be preparing to cut rates. Knowing this can help you make sense of why companies suddenly turn careful, why the news fills with recession talk, or why your central bank shifts direction. You are reading the same signal the professionals read.
Most powerfully, understanding the yield curve gives you a rare thing: a simple, visual way to glimpse the collective expectations of the entire financial world. One upward or downward slope, and you can see whether the smart money expects sunshine or storms ahead.
Difficult words, made simple
| Term | Plain-English meaning |
|---|---|
| Yield curve | A chart showing bond yields across different lengths of time |
| Yield | The return a bond pays, as a percentage |
| Short-term bond | A bond repaid soon, in months or a couple of years |
| Long-term bond | A bond repaid far in the future, up to thirty years |
| Normal curve | An upward slope where longer bonds pay more — a healthy sign |
| Inverted curve | A downward slope where shorter bonds pay more — a warning sign |
| Recession | A period when the economy shrinks |
The big takeaway
The yield curve is just a line showing how much bonds pay across different lengths of time. Normally it slopes upward, because lending for longer should earn more — a sign of a healthy, growing economy. But when it inverts and slopes downward, with short-term bonds paying more than long-term ones, it reveals that investors expect the economy to weaken and interest rates to fall.
That inversion has warned of nearly every US recession for decades, making it one of the most respected signals in economics. It is not a perfect predictor, and it works best read alongside other signs. But for a single, simple line, it offers something extraordinary: a real-time view of what the entire financial world expects about the future. Learn to glance at its shape, and you gain a window into the economy that most people never even know is there.
Sources
This article explains standard principles of the yield curve and its historical relationship with recessions. It is general educational information, not financial advice.
Related reading: Bonds Explained and Recession vs Depression.
Growmmunity publishes explanations, not financial advice.