
Credit Card Debt Hits $1.26 Trillion: The Two Numbers Telling Opposite Stories About America
Credit card debt in America has reached $1.26 trillion — up $21 billion in a single quarter and closing back in on the all-time record, according to the New York Fed’s latest Household Debt report. Total household debt now stands at $18.8 trillion, with auto loans setting their own record at $1.71 trillion.
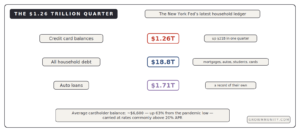
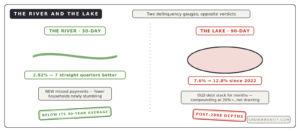
But the trillion-dollar headline isn’t the interesting part. The interesting part is a contradiction buried in the same data. One delinquency gauge shows Americans improving: the share of balances 30+ days late fell to 2.92% — the seventh straight quarterly decline, below its own 30-year average. Another gauge shows historic distress: the share of balances 90+ days late has surged from 7.6% to 12.8% since 2022 — by one first-quarter reading, the worst since the aftermath of the 2008 crisis. Same country, same cards, opposite verdicts.
If you’ve read our jobs-report guide or the China two-surveys story, you know the drill: when credible numbers disagree, ask what each one measures. This guide does exactly that — plus the minimum-payment math every cardholder should see once, why “record debt” isn’t automatically a crisis, and what this says about the paycheck-to-paycheck economy. In plain English. (New to economics? Start with What Is an Economy?)
First: what actually is credit card debt?
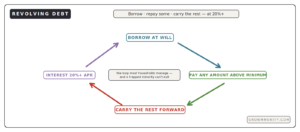
A credit card is a revolving loan: borrow at will up to a limit, repay any amount above a minimum, carry the rest forward — at interest rates that commonly sit above 20% APR, among the most expensive mainstream money there is. “Credit card debt” in these statistics means the balances Americans are carrying at any moment: now $1.26 trillion, or roughly $6,600 for the average cardholder — up about 63% from the pandemic-era low.
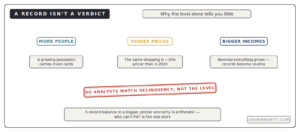
One honest caveat before alarm sets in: part of any “record” is simply growth. More people, higher incomes, and prices up ~30% since 2020 mean the same shopping produces bigger card statements. A record level of debt is expected in a growing economy — which is exactly why analysts watch the delinquency rates instead. That’s where the real story lives.
The two thermometers: 30-day vs 90-day
Picture card debt as a river flowing into a lake.
The 30-day rate (2.92%, improving) measures the river — how many new payments are being missed right now. Seven straight quarters of improvement says fewer households are newly stumbling; the Fed’s researchers confirm delinquency rates “across most products remained fairly stable,” and the improvement follows a rough stretch of eleven straight quarterly increases.
The 90-day rate (7.6% → 12.8%, historic) measures the lake — the pool of old debt that got stuck and never left. The New York Fed’s own researchers note the elevated readings trace largely to old outstanding debts rather than fresh missed payments: balances that went bad during the 2022-2024 squeeze, compounding at 20%+ ever since, too deep for their owners to climb out of.
Put together, the picture isn’t “everyone is drowning” or “everything is fine.” It’s a split economy: most households have steadied — while a trapped minority sinks deeper into the same pool. As a Fed researcher put it: “There are a lot of households who live paycheck to paycheck, and it just needs one thing to happen to them that could lead to a delinquency.”
The math every cardholder should see once
Why does old card debt become a trap rather than a setback? One worked example, from consumer-finance research, makes 20%+ APR visceral:
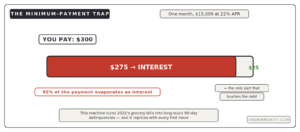
A household carrying $15,000 at 22% APR pays roughly $275 a month in interest alone. If their minimum payment is $300, then only $25 touches the actual debt — the other 92% of the payment evaporates as interest. At that pace, repayment takes decades. This is the minimum-payment trap, and it’s the machine that turns 2022’s grocery bills into 2026’s 90-day delinquencies. It’s also why card rates matter so much more than their sticker suggests: they ride on the Fed’s rate — the one currently being debated upward — so every hike quietly raises the cost of every carried balance in the country.
What the record really signals
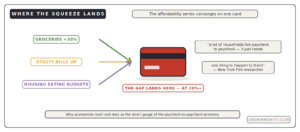
Card balances are where the whole affordability series converges. Prices that never came back down, swelling utility bills, housing eating budgets — when income runs out before the month does, the gap lands on a card at 20%+, or increasingly on a pay-in-four plan beside it. That’s why economists read card data as a strain gauge for the paycheck-to-paycheck economy: the “low-hire, low-fire” job market we’ve tracked keeps most people employed and current on payments — and leaves the unlucky minority, hit by that “one thing,” with the most expensive debt in mainstream finance and no easy exit.
Two honest views: resilience or a slow-motion squeeze?
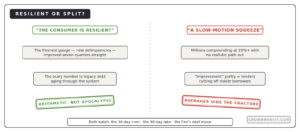
The “resilient consumer” view: the freshest signal — new delinquencies — has improved for seven straight quarters and sits below its 30-year average; balances relative to incomes remain manageable; and much of the scary 90-day number is legacy debt aging through the system, not new distress. A record nominal level in a bigger, pricier economy is arithmetic, not apocalypse.
The “split economy” view: averages are hiding a fracture. A 90-day rate at post-2008 levels means millions are compounding at 20%+ with no realistic path out; the improvement in new delinquencies partly reflects lenders cutting off riskier borrowers, not those borrowers healing; and with rates possibly rising further, the trapped pool gets more expensive to escape every quarter. Records plus historic late-stage distress is what a slow-motion squeeze looks like from above.
Both camps watch the same dials: the 30-day rate (does the river stay calm?), the 90-day rate (does the lake finally drain?), and the Fed’s decisions — because every card in America reprices with them.
Difficult words, made simple
| Term | Plain-English meaning |
|---|---|
| Revolving debt | Borrow, repay, carry forward — the credit card model |
| APR | The yearly interest rate — commonly 20%+ on cards, the priciest mainstream money |
| Balance | What’s owed right now — $1.26 trillion nationally, ~$6,600 per cardholder |
| Delinquency | A payment 30+ days late — the economy’s stress signal |
| Late-stage (90+) delinquency | Debt stuck for three months+ — the lake, now at post-2008 depths |
| Minimum payment | The smallest allowed payment — often barely covering interest |
| The minimum-payment trap | $300 paid, $275 to interest, $25 to debt — decades to freedom |
| Household debt | Everything families owe — $18.8 trillion including mortgages, autos, students, cards |
| Paycheck to paycheck | No buffer — where “one thing happening” becomes a delinquency |
| Nominal record | A biggest-ever number that partly just reflects a bigger, pricier economy |
The big takeaway
America’s card debt is two stories wearing one trillion-dollar number. Read the river — new delinquencies improving for seven quarters — and the consumer looks resilient. Read the lake — late-stage distress at post-crisis depths — and a trapped minority is compounding at 20%+ with no exit. Both are true, which is precisely the point: the modern economy’s favourite trick is hiding a fracture inside an average.
Three ideas worth keeping. First, never judge debt by its level alone — growth makes records normal; delinquency tells you who’s actually hurting. Second, learn the two thermometers — 30-day flow vs 90-day pool — and most “consumers are fine / consumers are drowning” headline fights dissolve. Third, respect the math: at 22%, a $300 payment can move a debt just $25 — which is everything anyone needs to know about why this particular lake drains so slowly.
New to economics? Start with What Is an Economy? — then read the Buy Now, Pay Later explainer and Why Are Groceries So Expensive? for the squeeze that feeds these balances.
Sources
This article synthesizes reporting from Yahoo Finance, ABC News, and LendingTree:
• Yahoo Finance: Credit card debt climbs to $1.26 trillion: What the latest data means for consumers
• ABC News: Credit card debt rises to $1.26 trillion, nearing all-time record
• LendingTree: 2026 Credit Card Debt Statistics
All figures are drawn from those reports and the Federal Reserve Bank of New York’s Household Debt and Credit data cited within them; the $15,000-at-22% illustration is from consumer-finance research and is arithmetic, not a recommendation. This article presents both readings of the data without endorsing either. This is general information, not financial advice.
Growmmunity publishes explanations, not financial advice.