
Why Are Groceries So Expensive If Inflation Is “Cooling”? The Odometer Trick, Explained
Why are groceries so expensive when every headline says inflation is calming down? Because two different things are being measured — and confusing them is probably the single most common misunderstanding in all of economics. Grocery inflation has slowed to a modest couple of percent a year. Grocery prices, meanwhile, are up roughly 30% since 2020 — about 34.6% since 2019, by NerdWallet’s count — and they are never going back.
The public feels the gap. Nearly half of Americans say groceries have become harder to afford, per an Axios/Harris survey, and the University of Michigan’s consumer-sentiment index touched an all-time low for economic optimism in August 2026. As food economist David Ortega put it with perfect precision: falling inflation “doesn’t mean that food prices are coming down. It just means that they’re not increasing as quickly.”
This guide explains the crucial difference between the rate and the level of prices, why economists actually don’t want your grocery bill to fall, which specific items are driving the pain, and what genuinely helps — in plain English. (New to economics? Start with What Is an Economy? and Inflation Explained.)
The core idea: the speedometer and the odometer
Think of a car. The speedometer shows how fast you’re going right now. The odometer shows how far you’ve already travelled — and it only ever goes up.
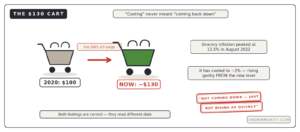
Inflation is the speedometer. When news says “inflation cooled to 2%,” it means prices are now climbing slowly — the car slowed from 90 mph (grocery inflation hit 13.5% in August 2022) to about 20 mph. Prices are the odometer. All those miles driven during 2021-2023 are permanently on the clock. A $100 grocery cart that became $130 doesn’t return to $100 when inflation cools; it just becomes $130 rising gently instead of violently.
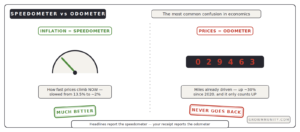
So both statements are true at once: inflation is much better (the speedometer) and groceries have rarely felt worse (the odometer). Headlines report the first; your receipt reports the second. That’s the whole trick — and once you see it, the “but they SAID inflation was over!” frustration finally makes sense.
Why don’t prices just come back down?
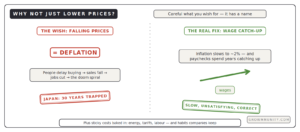
Here’s the part that sounds outrageous until it’s explained: economists don’t want the odometer to run backwards — because broadly falling prices are called deflation, and deflation is the sign of a sick economy. As Ortega notes, falling prices mean people are spending less, which leads to higher unemployment — the doom-spiral we unpacked in our deflation explainer (Japan spent thirty years trapped in it). The realistic best case was always this: inflation slows to ~2%, and wages spend years catching up to the new price level. That’s the plan working, even though it feels like a broken promise.
There are also stickier reasons on the shelf itself: labour, transport, and energy costs — pushed up again by the Middle East war — sit permanently inside every price; tariffs add import costs; and once shoppers have accepted a price for a few years, companies rarely volunteer to lower it. Some brands, as consumer reporting bluntly notes, keep prices elevated simply because they can.
The category rollercoaster: it’s never “groceries” — it’s specific foods
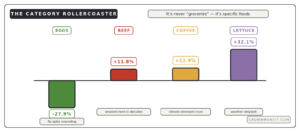
The national grocery number hides wild swings underneath — the same lesson about baskets from our CPI explainer. NerdWallet’s category breakdown shows the rollercoaster:
| Item | Change over a year | The story |
|---|---|---|
| Eggs | -27.9% | Avian-flu spike unwinding — proof specific shocks do reverse |
| Beef & veal | +11.8% | A multi-decade-low cattle herd takes years to rebuild |
| Coffee | +12.9% | Climate stress on growing regions |
| Lettuce | +32.1% | Weather and disease whiplash in produce |
Notice the pattern: supply shocks are item-by-item stories — a flu, a drought, a shrunken herd — layered on top of the permanent post-2020 level. The USDA expects food-at-home prices to rise about 3.1% in 2026: close to historical norms, but again, climbing from the new, higher base. And a quieter tax rides along: shrinkflation — same price, smaller package — an inflation the speedometer barely registers.
Why this matters beyond the checkout line
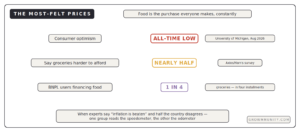
Food is the most frequent purchase humans make, which makes grocery prices the most felt prices in the economy — sentiment surveys track them more closely than any statistic. The strain shows up exactly where our earlier reporting found it: a quarter of buy-now-pay-later users now finance their food shopping in four installments, and the burden lands hardest on lower-income households in a year when food-assistance benefits shrank for many. When economists say “inflation is beaten” and half the country disagrees, both are reading real numbers — one group the speedometer, the other the odometer. Bridging that gap is half of understanding the modern economy’s mood.
Two honest views: mission accomplished or moved goalposts?
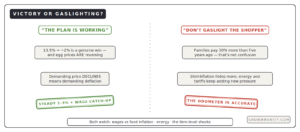
The “it’s working” view: inflation collapsing from 13.5% to ~2% on groceries is a genuine policy victory; specific spikes (eggs) are already reversing; and demanding actual price declines means demanding deflation — a cure worse than the disease. The healthy path — steady 2-3% food inflation while wages catch up — is precisely what the data now shows.
The “don’t gaslight the shopper” view: declaring victory on a rate while families pay 30% more than five years ago mistakes the map for the territory. Wage catch-up is uneven and slow, energy and tariffs keep adding new pressure, shrinkflation hides more, and consolidation means less competition to push prices down where they could fall. The all-time-low sentiment reading isn’t confusion — it’s an accurate report from the odometer.
Both agree on what to watch: wage growth vs food inflation (the only real repair mechanism), energy prices (the input inside everything), and the item-level shocks — eggs, beef, coffee — that decide whether any given month feels like relief or another squeeze.
Difficult words, made simple
| Term | Plain-English meaning |
|---|---|
| Rate vs level | How fast prices climb vs how high they already are — speedometer vs odometer |
| Disinflation | Inflation slowing down — prices still rising, just gently |
| Deflation | Prices actually falling — sounds great, signals a sick economy |
| Food-at-home | The official name for grocery prices (vs restaurants, “food away from home”) |
| Sticky prices | Once raised, rarely lowered — shoppers adapt, companies keep the gain |
| Supply shock | An item-specific hit — avian flu, drought, a shrunken cattle herd |
| Shrinkflation | Same price, smaller package — inflation the headline number barely sees |
| Wage catch-up | Pay slowly regaining lost ground against the new price level — the real fix |
| Consumer sentiment | How people feel about the economy — at an all-time low, driven by food and gas |
| Basket weights | Why one exploding item (lettuce +32%) can outweigh a falling one in your bill |
The big takeaway
Groceries are expensive because the 2021-2023 surge permanently raised the odometer, and “cooling inflation” only ever promised to slow the speedometer. Both the triumphant headlines and the frustrated shoppers are right — they’re just reading different dials. The honest summary: the emergency is over; the bill for it is permanent; and the repair runs through paychecks, not price tags.
Three tools worth keeping. First, whenever inflation news confuses you, ask: rate or level? — it resolves ninety percent of the arguments. Second, never wish for falling prices across the board — that wish has a name, and Japan can tell you about it. Third, read your own receipt item by item: eggs reversing, beef grinding higher, coffee climbing — the “grocery crisis” is really a dozen small supply stories stacked on one big level shift, and they resolve one at a time.
New to economics? Start with Inflation Explained and Deflation Explained — the two halves of this story — then What Is CPI? for how the basket is measured.
Sources
This article synthesizes reporting from Marketplace, NerdWallet, and Forbes:
• Marketplace: Why are food prices so high?
• NerdWallet: Why Is Food So Expensive?
• Forbes: Food Prices Keep Rising, So What’s Driving Grocery Costs?
All figures are drawn from those reports and the sources cited within them, including the Bureau of Labor Statistics, the USDA, the Axios/Harris Poll, and the University of Michigan sentiment survey. This article presents both readings of the data without endorsing either. This is general information, not financial advice.
Growmmunity publishes explanations, not financial advice.