
Stock Market Indexes Explained: What the S&P 500, Dow, and Nasdaq Really Measure
Stock market indexes are the numbers you hear every single day: “the S&P 500 rose today,” “the Dow fell 300 points,” “the Nasdaq hit a record.” These three names are repeated so often that they feel like the very heartbeat of the economy. Yet most people have no idea what they actually measure, or why there are three different ones all seeming to say similar things.
The good news is that the idea behind them is simple. An index is just a way of summarizing how a whole group of stocks is doing with a single number. Today we will explain what each of the big three indexes measures, how they differ, and how to read them intelligently — all with clear, everyday examples.
Why we need indexes at all
There are thousands of companies listed on US stock exchanges. Imagine trying to answer a simple question — “how did the stock market do today?” — by checking all of them one by one. It would be impossible to make sense of.
An index solves this. It takes a selected group of stocks and combines them into a single number that summarizes their overall movement. Instead of tracking thousands of individual prices, you glance at one figure and instantly know whether the market, broadly, went up or down.

Think of it like a report card. A student takes many subjects, but a grade point average condenses all of them into one number that captures overall performance. An index does the same for a basket of stocks: it is the market’s grade point average, updated every second.
The S&P 500: the broad picture
The S&P 500 is the index most professionals consider the best snapshot of the US stock market. It tracks the share prices of about 500 of the largest US companies, spanning technology, healthcare, banking, retail, energy, and more.
Because it includes 500 big companies across many industries, the S&P 500 gives a broad, balanced picture of how corporate America as a whole is performing. When economists or investors talk about “the market” being up or down, they most often mean the S&P 500. If you want a single number to represent the health of US stocks, this is the one to watch.

One important detail: the S&P 500 is weighted by company size. This means the biggest companies have a larger influence on the index than smaller ones. If a giant technology company has a great day, it moves the S&P 500 more than a smaller company would. This makes the index reflect where the real value sits, but it also means a handful of enormous companies can heavily sway the whole number.
The Dow: the old famous one
The Dow Jones Industrial Average — usually just called “the Dow” — is the oldest and most famous of the three, created back in the 1890s. It is the index that most often makes newspaper headlines, partly out of long tradition.
But the Dow is quirky. It tracks only 30 large, well-known American companies — a tiny sample compared to the S&P 500. And it uses an unusual, outdated method: instead of weighting by company size, it weights by share price. This means a company with a high share price sways the Dow more than a company with a low share price, even if the second company is actually much larger overall. That is a strange way to measure things, and it is why many professionals consider the Dow less meaningful than the S&P 500.

Still, because of its history and fame, the Dow remains a cultural touchstone. When people casually ask “how did the market do?”, they are often thinking of the Dow, even if the S&P 500 tells a more accurate story.
The Nasdaq: the technology-heavy one
The Nasdaq Composite tracks the thousands of companies listed on the Nasdaq exchange — and crucially, it is heavily weighted toward technology companies. Many of the world’s biggest tech names are central to it.
Because of this tech concentration, the Nasdaq behaves differently from the other two. When technology is booming, the Nasdaq often soars higher than the S&P 500 or the Dow. When technology stumbles, the Nasdaq tends to fall harder. It is the most exciting and the most volatile of the three, rising and dropping more dramatically because it is so concentrated in one fast-moving sector.
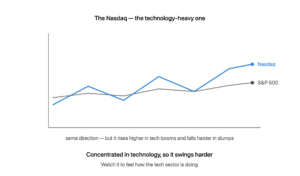
Watching the Nasdaq tells you, above all, how the technology sector is doing — and since technology has become such a huge part of the modern economy, that has never mattered more.
Why the three often move together — but not always

Most days, all three indexes move in the same general direction, because they all reflect the same broad US economy. Good economic news tends to lift all of them; bad news tends to drag them all down.
But the differences between them show up in the details. On a day when technology stocks surge but other industries are flat, the Nasdaq might jump while the Dow barely moves. On a day when a few older industrial giants do well, the Dow might rise while the tech-heavy Nasdaq lags. Watching how the three diverge tells you which part of the economy is driving the day’s action.
This is the real skill in reading indexes: not just noting whether they went up or down, but understanding what their differences reveal about which sectors are strong and which are weak.
What “points” really mean
When the news says “the Dow fell 300 points,” that number can sound alarming or impressive, but points alone can mislead. What matters is the percentage change, not the raw points.

A 300-point drop in an index sitting at 40,000 is less than a 1% move — a fairly ordinary day. The same 300-point drop in a much smaller index would be a huge deal. Always translate points into percentages to know whether a move is genuinely big or just sounds big. This single habit will make you a far sharper reader of market news than most people.
Why this matters to you
Even if you never buy a single stock, indexes affect and inform your life. They shape the value of retirement savings and pension funds, which are often invested in the companies these indexes track. They serve as a barometer of economic confidence that influences business decisions and news coverage worldwide.
And they give you, at a glance, a read on the mood of the economy. When you understand that the S&P 500 shows the broad market, the Dow shows 30 famous names through an old-fashioned lens, and the Nasdaq shows the technology world, these daily numbers stop being background noise. They become a quick, meaningful signal you can actually interpret — a way to feel the pulse of the world’s largest economy in a single glance.
Difficult words, made simple
| Term | Plain-English meaning |
|---|---|
| Index | A single number summarizing how a group of stocks is doing |
| S&P 500 | An index of about 500 large US companies; the broad market view |
| Dow Jones | An old index of just 30 famous companies, weighted oddly |
| Nasdaq | A technology-heavy index that moves more dramatically |
| Weighting | How much influence each company has on an index |
| Points | The raw units an index moves; less useful than percentages |
| Volatility | How much and how quickly prices swing up and down |
The big takeaway
Stock market indexes are simply single numbers that summarize how a group of stocks is doing. The S&P 500 tracks about 500 large companies and gives the broadest, most trusted view of the US market. The Dow tracks just 30 famous names through an old-fashioned method and survives mostly on tradition and headlines. The Nasdaq is packed with technology companies and swings more dramatically as a result.
Read together, they tell you not just whether the market went up or down, but which parts of the economy drove the move. And remember the golden rule: always think in percentages, not points. Master these ideas, and the daily flood of market numbers transforms from confusing noise into a clear, readable signal of how the economy is feeling — all captured in three simple figures.
Sources
This article explains standard principles of how major stock indexes are constructed and read. It is general educational information, not financial advice.
Related reading: The Stock Market Explained.
Growmmunity publishes explanations, not financial advice.