
How to Read Economic News: Turning Headlines Into Understanding
How to read economic news is a skill that transforms the daily flood of confusing headlines into something you can actually understand and use. Every day, the news is full of reports about interest rates, inflation, jobs, GDP, markets, and more — and for most people, it washes over them as background noise, intimidating and impenetrable. But after everything we have explored together, you now hold the keys to decode it. Economic news is not a foreign language once you understand the ideas beneath it.
Today we will pull together everything from this series into a practical guide for reading economic news with real understanding. We will look at the major types of reports you will encounter, how to interpret them, the traps to avoid, and how to connect the headlines into a coherent picture of what is happening in the economy. This is where all the pieces come together.
The major economic reports, and what they really mean
Most economic news revolves around a handful of key reports that appear on a regular schedule. You have already learned what each one means. Here is how to read them when they appear in the news.
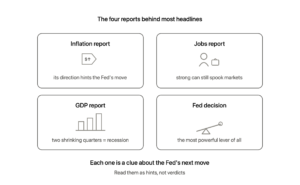
Inflation reports. These tell you how fast prices are rising, as we covered in Inflation Explained. When you see an inflation number, the key is to compare it to what came before and to the central bank’s target. Rising inflation may signal that interest rate hikes are coming; falling inflation may signal cuts. The number itself matters less than its direction and what it implies the Fed will do.
Jobs reports. These show how many people are working and how many are unemployed. A strong jobs report suggests a healthy, growing economy — but as we learned, it can also raise fears of inflation and higher rates. A weak report suggests a slowing economy and possible rate cuts. This is why good news on jobs sometimes makes markets fall, a paradox that now makes perfect sense to you.
GDP reports. These measure whether the economy grew or shrank, as we saw in GDP Explained. Two consecutive quarters of shrinking GDP is the classic marker of recession. When you see GDP figures, you are reading the fundamental health of the whole economy.
Central bank decisions. When the Fed announces a rate decision, you now understand it is pulling the most powerful lever in the economy. The decision, and the words used to explain it, ripple through borrowing, saving, markets, and currencies worldwide.
Reading between the lines: what markets expect
Here is one of the most important and least obvious lessons about economic news. Markets do not just react to the news itself — they react to how the news compares to what was expected.
Picture two students on results day. One expected to score 95 and got 90 — she walks out disappointed. The other expected 70 and got 80 — he is celebrating, even though his score is lower than hers. Markets grade the economy exactly the same way: not against zero, but against expectations.
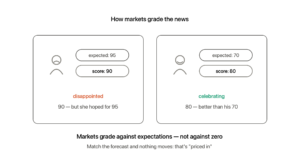
This is why a company or an economy can report strong numbers and still see its market value fall, or report weak numbers and rise. What matters is the surprise: the gap between what actually happened and what everyone already anticipated. If markets expected inflation to fall and it fell exactly as predicted, little may happen, because the expectation was already “priced in.” If it fell far more than expected, markets may jump.
Once you understand this, a great deal of confusing market behavior suddenly makes sense. When you read that markets moved on some news, always ask: was this better or worse than expected? That question, more than the raw number, explains the reaction. It is one of the most powerful lenses for reading financial news.
Connecting the dots: everything is linked
The single most valuable skill in reading economic news is seeing how everything connects. As this entire series has shown, the parts of the economy are deeply linked, and the real understanding comes from tracing those links.
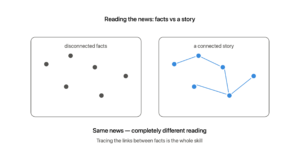
Consider how a single piece of news flows outward. Suppose inflation comes in higher than expected. You can now trace the chain yourself: higher inflation makes rate hikes more likely, higher rates raise borrowing costs and tend to strengthen the dollar, a stronger dollar pressures emerging markets and affects trade, and higher rates also weigh on stocks. One report, rippling through the whole system.
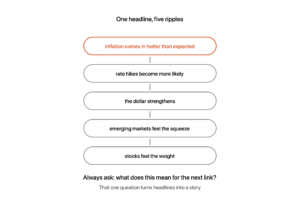
This is the difference between reading news as a list of disconnected facts and reading it as a connected story. When you see one piece of news, ask what it means for the next link in the chain — for rates, for markets, for currencies, for the wider economy. This web of cause and effect is the real economy, and following it is what turns headlines into genuine understanding.
Traps to avoid
Reading economic news well also means avoiding some common traps that mislead even experienced observers. Watch for these.
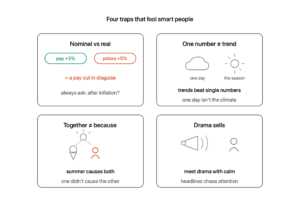
Confusing nominal and real. As we learned, always ask whether a number accounts for inflation. A figure that looks like growth may just be rising prices. A 3% pay rise during 5% inflation is a pay cut in disguise. Real, inflation-adjusted numbers tell the true story.
Reacting to single numbers. One month’s data can be noisy and misleading. Think of it like weather: one cold day does not end summer, and one report is just a day’s weather — the trend is the climate. Trends over time matter far more than any single report. Do not let one dramatic number sweep you away.
Confusing correlation and cause. Just because two things happen together does not mean one caused the other. Ice cream sales and sunburns rise together every year — but ice cream does not cause sunburn; summer causes both. News often implies causation where there is only coincidence.
Getting swept up in fear or hype. Economic news is often dramatic, because drama attracts attention. Sensational headlines about crashes or booms deserve calm, critical thinking, not panic or euphoria. A steady, informed perspective is your greatest asset.
Building your own economic perspective
The ultimate goal is not to memorize what any one report means, but to build your own framework for understanding the economy — a mental model into which each new piece of news can fit.
With the foundations from this series, you can now place any headline into a bigger picture. A rate decision connects to inflation and growth. A jobs report connects to the Fed’s next move. An oil price spike connects to inflation and the cost of living. Nothing arrives as an isolated shock anymore; each piece finds its place in a web you understand.
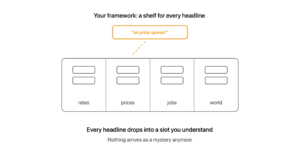
This framework is what separates those who are informed by the news from those who are merely overwhelmed by it.
Why this matters to you
Being able to read economic news is genuinely empowering. It changes your relationship with the world around you, replacing confusion and intimidation with understanding and confidence. The headlines that once felt impenetrable become a source of insight into the forces shaping your job, your money, your costs, and your future.
This understanding also helps you make better decisions. When you grasp what rising rates mean, or how inflation affects your savings, or why a global event might raise your cost of living, you are better equipped to plan, to prepare, and to avoid being caught off guard. Economic literacy is a practical life skill, not an academic exercise.
Most of all, reading economic news well means you are no longer a passive spectator of the economy but an informed participant in it. You can follow the great forces shaping the world, understand how they connect, and see how they reach into your own life. That is the real reward of everything we have learned — the ability to look at the swirling, complex, interconnected global economy and, instead of feeling lost, to understand what you are seeing.
Difficult words, made simple
| Term | Plain-English meaning |
|---|---|
| Priced in | When markets already expected news, so it’s built into prices |
| Expectations | What markets anticipate will happen before news arrives |
| Consensus | The average forecast most analysts agree on |
| Nominal vs real | Before vs after adjusting for inflation |
| Correlation | Two things moving together, not necessarily one causing the other |
| Data point | A single number from one report or moment in time |
| Framework | A mental model for organizing and understanding information |
The big takeaway
Reading economic news is a skill you now possess. The major reports — inflation, jobs, GDP, and central bank decisions — each tell a piece of the story, and you understand what each one means and what it implies for the powerful lever of interest rates. The deeper skill is reading between the lines: markets react not to news itself but to how it compares with expectations, which explains much otherwise puzzling behavior.
Above all, reading economic news well means connecting the dots, tracing how one report ripples through rates, markets, currencies, and the wider world, while avoiding traps like confusing nominal with real or reacting to single numbers. This builds your own framework — a way to place any headline into a bigger picture. The result is genuine empowerment: the ability to look at the complex global economy not with confusion, but with understanding.
Sources
This article synthesizes standard principles of economics and financial markets into a practical guide. It is general educational information, not financial advice.
Related reading: Inflation Explained, GDP Explained, and Why Stock Prices Move.
Growmmunity publishes explanations, not financial advice.