
Why Oil Prices Are Rising: The Strait of Hormuz, Explained
This morning’s market headlines paired two events that, at first glance, belong in different sections of the newspaper: military strikes near a waterway most people couldn’t find on a map — and the price of oil rising around the world.
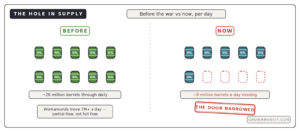
They are, in fact, the same story. The waterway is the Strait of Hormuz, and for months it has been the single most important place in the global economy. Before the current conflict, roughly 20 million barrels of oil and fuel per day — about a fifth of the world’s supply — squeezed through this narrow passage between Iran and Oman. Today, analysts estimate the world is losing about 8 million barrels a day to the disruption.
This guide explains why one strip of sea sets the price of energy everywhere, why oil prices have been swinging violently on nothing but words, what a “tipping point” means, and how all of it eventually reaches the pump and the price of nearly everything you buy — in plain English, with no side-taking on the conflict itself. (New to economics? Start with our foundation guide, What Is an Economy?)
First: what is a chokepoint, and why does this one rule the oil market?
A chokepoint is a narrow passage that a huge share of trade must physically pass through. Think of a stadium with 80,000 seats and a handful of exits: it doesn’t matter how big the stadium is — what matters is the width of the doors.
The Strait of Hormuz is the most important door in the energy world. The oil of Saudi Arabia, Iraq, Kuwait, Qatar, the UAE, and Iran largely has no other practical way to reach the ocean. At its narrowest, the shipping lanes are just a few kilometres wide. There is no pipe, train, or truck network on earth that can replace what flows through that water.
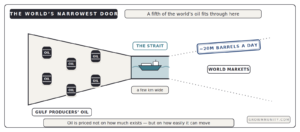
That geography explains a rule of thumb worth memorising: oil is priced not on how much exists, but on how easily it can move. The ground beneath the Gulf holds as much oil as it did last year. The price is higher because the door narrowed.
Quick vocabulary while we’re here: you’ll see two prices in every report. Brent (currently around $94 a barrel) is the international benchmark; WTI (around $87) is the US benchmark. Same product, different delivery points — like the same coffee priced at two different airports.
The background: how we got to an 8-million-barrel hole
If you’ve followed our earlier explainer on US sanctions on Iran, this is the next chapter of that story. The short version of a long six months:
1. War closed the door. After the conflict broke out, Tehran effectively blocked exports through Hormuz, and prices spiked toward $110 a barrel at the worst point — the kind of surge that had forecasters raising recession odds worldwide.
2. A workaround opened it partway. The US military says it has helped tankers move more than 660 million barrels through the strait since early May — recently over 7 million barrels a day. Partial flow resumed; prices came down from their peaks.
3. Diplomacy became the price driver. Through August, oil traded almost entirely on deal headlines. Hopes of a US-Iran agreement to reopen the strait sent Brent down more than 7% in a single week. When the deal failed to materialise and rhetoric escalated, prices climbed 5% the next. Talk of Iran’s “economic isolation” pushed them up again. Reports of renewed talks through Oman — and a presidential post declaring the strait’s mines cleared — pulled them back down. This weekend’s strikes near the strait sent them up once more.
Notice the pattern: for weeks, almost nothing changed physically. The same reduced volume of oil flowed. Prices swung anyway — sometimes violently — on words, posts, and probabilities.
Why do prices move when nothing physical changes?
If you read our Jackson Hole explainer, you already know the answer, because oil traders work exactly like Fed watchers: markets trade on probabilities, not events.
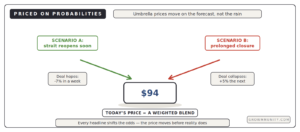
At any moment, the oil price is a weighted blend of possible futures. Capital Economics describes today’s market as pricing two opposing scenarios at once: a quick reopening of Hormuz, and a prolonged closure. Every headline shifts the perceived odds between those futures, and the price shifts with them — before anything happens in the physical world.
A weather analogy: the price of umbrellas doesn’t wait for rain. It moves on the forecast. And in oil, the forecast changes hourly.
One bank’s math makes the stakes concrete: Commonwealth Bank of Australia expects Brent between $70 and $100 for the rest of the year — and notes that restoring just 50-60% of pre-war flows through Hormuz could be enough to flip market psychology back toward oversupply and drag prices toward the bottom of that range. The same barrels, moving or not moving, are worth a $30 swing.
The concept that decides what happens next: the tipping point
Here’s the most important idea in this story, and it explains why analysts sound calm today but nervous about next month.
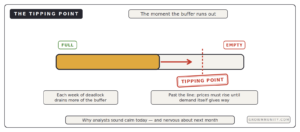
The world holds enormous oil inventories — strategic reserves, commercial tanks, ships at sea. When supply is disrupted, the world doesn’t immediately go without; it drains the savings account. That buffer is why an 8-million-barrel daily hole has produced high-but-not-catastrophic prices rather than queues at petrol stations.
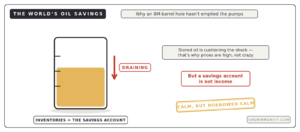
But a savings account is not income. Capital Economics calls the danger moment the “tipping point” — the point at which inventories are drawn down far enough that they can no longer absorb the shock, and demand itself has to adjust. In plain English: prices rising until enough businesses and drivers simply can’t afford to buy. That is the scenario the market is watching for, and why each week of deadlock matters even when the headlines repeat.
One more wrinkle the pump already feels: the diesel market is especially tight, squeezed from two directions at once — Middle East refinery outages and attacks on Russian refineries in the Ukraine war. Diesel is the fuel of trucks, trains, tractors, and ships, which makes it the fuel of prices in general. When diesel is expensive, delivering everything is expensive.
How a strait you’ll never see reaches your wallet
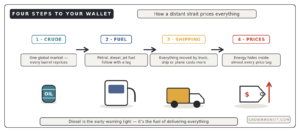
The transmission chain, step by step:
Step 1: Crude rises. The narrowed strait raises the world price of raw oil — every barrel everywhere, not just Gulf oil, because oil is one global market.
Step 2: Fuel follows. Petrol, diesel, jet fuel, and heating oil track crude with a lag of days to weeks. (If pump prices seem slow to fall when crude drops — that lag is also real, and asymmetric.)
Step 3: Everything shipped follows fuel. Food hauled by truck, goods moved by container ship, flights, deliveries — energy is a cost inside almost every price tag. This is how an oil shock becomes general inflation, which is precisely why central bankers watching prices — like the Fed chair we covered at Jackson Hole — treat energy shocks so seriously.
Step 4: Fear feeds gold. The same geopolitical anxiety pushing oil up is part of what keeps driving investors and central banks into gold at record prices — oil and gold are two thermometers strapped to the same patient.
Two honest views: crisis contained or crisis delayed?
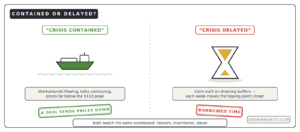
As always, both serious readings of the same facts.
The “contained” view: the system is working. Workarounds are moving millions of barrels daily, inventories are doing their job, prices sit far below the $110 panic peak, and both sides keep returning to negotiations — with Iran’s own president signalling he’d prefer the war to end sooner rather than later. On this view, the market has efficiently priced a manageable disruption, and any durable deal sends prices sharply lower.
The “delayed” view: calm built on inventory drawdowns is borrowed calm. The deadlock has outlasted repeated “imminent deal” headlines; each week burns more of the buffer and moves the tipping point closer. Add a tight diesel market and the risk of further escalation, and today’s moderate prices may understate the true risk — a disconnect analysts warn may not last.
Both views agree on the scoreboard to watch: tanker volumes through the strait, inventory levels, and diesel prices. Those three numbers, not the headlines, will tell you which view is winning.
Difficult words, made simple
| Term | Plain-English meaning |
|---|---|
| Chokepoint | A narrow passage that a huge share of trade must physically pass through — the stadium door |
| Strait of Hormuz | The narrow sea lane carrying ~20 million barrels a day before the war — the oil world’s front door |
| Brent / WTI | The international and US oil price benchmarks — same product, different delivery points |
| Barrel (bpd) | 159 litres of crude; “bpd” means barrels per day |
| Supply shock | A sudden cut in how much of something can reach the market |
| Inventories | The world’s stored oil — the savings account currently cushioning the shock |
| Tipping point | The moment inventories can no longer absorb the shortfall and prices must force demand down |
| Futures price | Today’s traded price for oil delivered later — where the probability-weighing happens |
| Diesel crack | The gap between crude and diesel prices — unusually wide now, a sign of refinery strain |
| Benchmark | A reference price everyone quotes so a global market can trade one number |
The big takeaway
Oil’s story this year is not really about how much oil the world has — it’s about a door. A few kilometres of water carry a fifth of the world’s oil, and everything in this saga follows from that single geographic fact: the $110 spike when the door shut, the swings on every diplomatic headline, the quiet drawdown of inventories keeping things manageable, and the tipping-point clock ticking underneath it all.
For a beginner, the transferable lessons are two. First, prices move on probabilities, not just events — the same rule we saw with the Fed applies barrel for barrel here. Second, buffers hide problems without solving them — the calm you see at the pump is partly the world spending its savings.
Three things worth watching from here: tanker traffic through Hormuz (the physical truth beneath the headlines), any US-Iran agreement (a durable deal could knock prices toward $70; escalation does the opposite), and diesel prices (the earliest warning light for costs spreading through everything else). The strait is only a few kilometres wide — but right now, the whole world economy is trying to fit through it.
New to economics? Start with What Is an Economy? — then read US Sanctions on Iran for the first chapter of this story, and Inflation Explained for where oil shocks end up.
Sources
This article synthesizes reporting from CNBC, NBC News, and investingLive:
• CNBC: Oil prices set for weekly rise as U.S. ups economic pressure on Iran
• CNBC: Oil price today: WTI, Brent, U.S. sanctions, Iran
• NBC News: Oil prices dip as optimism over Iran trumps new fears of a Russian escalation
• investingLive: Asia calendar, 31 August 2026 — U.S. strikes near Strait of Hormuz
All figures and quotes are drawn from those reports and the analysts cited within them, including RBC Capital Markets, Capital Economics, and Commonwealth Bank of Australia. Background on the waterway: Strait of Hormuz. This article explains the economics of the disruption and takes no position on the conflict itself. This is general information, not financial advice.
Growmmunity publishes explanations, not financial advice.
1 thought on “Why Oil Prices Are Rising: The Strait of Hormuz”