
Why Is Housing So Expensive? The $850-a-Month Hidden Cost Explained
Here is the strangest fact in the American economy right now: the housing market has been cooling for three straight years — sales falling, listings sitting longer, bidding wars fading — and yet for the average family, buying a home has rarely felt more out of reach.
Two numbers capture the whole story. The National Association of Realtors builds an affordability index where 100 means a median-income family can just barely qualify for a mortgage on a median-priced home. The overall index currently reads 105 — squeaking by. But for first-time buyers, the index sits at just 70. The people trying to get onto the ladder are furthest from reaching the first rung.
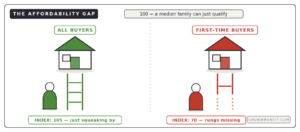
How can a market be cold and unaffordable at the same time? The answer involves a squeeze from two directions at once — and, hidden inside the gloom, a quiet shift in bargaining power that most headlines are missing. This guide explains all of it in plain English. (New to economics? Start with our foundation guide, What Is an Economy?)
First: what actually decides whether you can afford a home?
Beginners often fixate on the price tag. But almost nobody buys a house with cash — they buy a monthly payment. And a monthly payment has two ingredients:
Monthly payment = the price of the home × the price of the money.
The price of the money is the mortgage rate, and it matters far more than intuition suggests. Rough arithmetic on a $400,000 loan: at a 3% rate — normal just a few years ago — the principal-and-interest payment is around $1,700 a month. At today’s roughly 6.5-6.7%, the same loan on the same house costs about $2,550 a month. Nothing about the house changed. The money got expensive, and $850 a month of affordability evaporated.
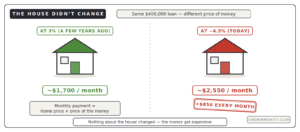
That is why mortgage rates dominate every housing headline — and why they connect straight back to stories we’ve already covered. Mortgage rates ride on Treasury yields, which have been pushed up by America’s $40 trillion debt, and on the Federal Reserve, whose new chairman just put a rate hike on the table at Jackson Hole. Housing is where those abstract stories land on a kitchen table.
The background: how we got squeezed
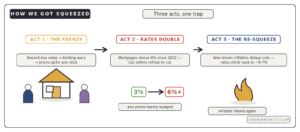
The current situation was built in three acts.
Act 1: The pandemic frenzy. Record-low interest rates sent an avalanche of buyers into a market with very few homes for sale. Bidding wars broke out everywhere; buyers routinely paid above asking price just to win. Home values spiked — and those higher prices became the new baseline.
Act 2: Rates doubled, prices didn’t fall. When inflation surged, the Fed pushed rates up hard, and mortgages have mostly sat above 6% since 2022. Normally, slower sales and growing supply drag prices down. This time, prices have barely budged through three consecutive years of sluggish sales — because most sellers, sitting on cheap pandemic-era mortgages and big paper gains, simply refuse to cut. The result: buyers face pandemic-level prices and doubled borrowing costs simultaneously.
Act 3: The squeeze renewed this year. Just when rate relief seemed near — mortgages briefly dipped below 6% in February — inflation flared again, partly as the Middle East conflict pushed oil and energy costs higher. That reduced expectations that the Fed will cut rates this year, and mortgage rates climbed back toward 6.7-6.8%. As one industry economist put it, many households remain simply priced out, and a sustained reduction in financing costs is what it would take to change that.
Notice the trap: buyers are squeezed from both directions — sellers won’t lower prices, and inflation won’t let rates fall. That is how a market can be cold and unaffordable at once.
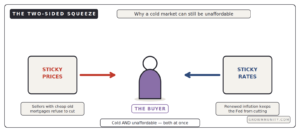
The part the gloomy headlines miss: leverage is shifting
Now for the twist. While affordability numbers grabbed the headlines, a different set of data has been quietly moving — and it points the other way.
The bidding wars have reversed. Realtor.com data shows the typical home now sells for less than its list price — a sharp turn from 2021-22, when paying above asking was the norm. The pandemic-era seller’s market has, on this measure, flipped.
Supply is rebuilding. Active listings are up about 3.2% from a year ago, at nearly 1.2 million homes — and rising new-home construction is giving qualified buyers more options and more room to negotiate.
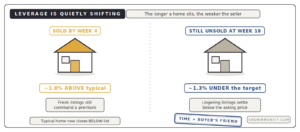
Time is now the buyer’s friend. The negotiating math is concrete: homes that go under contract within about four weeks still fetch roughly 1.8% above the typical sale, but listings still sitting at 18 weeks settle around 1.3% under the seller’s target. Every week a home lingers, the seller’s position weakens.
And it’s local. The national numbers hide a split market: the South and West currently hand buyers the most leverage, the Northeast remains the strongest seller territory, and the Midwest sits in between. “The housing market” is really dozens of markets wearing one name.
Put the two stories together and you get the genuinely interesting picture: homes are still expensive to finance, but for the first time in years, buyers who can afford to be in the market hold real bargaining power. One reporter framed it as the decision now facing Americans: keep waiting for rates to ease — or act on leverage the market hasn’t offered in years.
Why housing matters even if you’re not buying
It’s tempting to file this under “personal finance.” It’s much bigger than that.
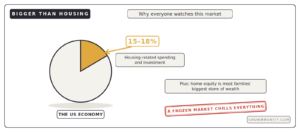
Housing-related spending and investment accounts for roughly 15% to 18% of all US economic activity — construction, furniture, appliances, renovations, moving, the lot. And home equity is the single biggest store of wealth for most American households. When housing freezes, people don’t just delay buying homes; they delay everything that comes with a home, and they feel less wealthy — which cools spending across the economy. (We saw the same wealth-effect mechanism, in more extreme form, dragging on China in our China slowdown explainer — different country, same human psychology.)
That is why economists, central bankers, and markets watch housing so closely: it is both a huge slice of the economy and a mood ring for the consumer. A frozen housing market is never just a housing problem.
Two honest views: wait, or use the leverage?
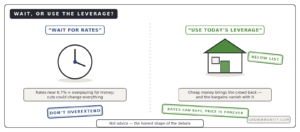
As always, both serious positions — and note this is a description of the debate, not advice.
The “wait” case: affordability is objectively stretched — a first-time index of 70 says so — and rates near 6.5-6.7% mean overpaying for money. If inflation cools and the Fed eventually cuts, mortgages could cheapen meaningfully, and stretched buyers who waited will have avoided years of inflated interest. Rushing into the largest purchase of your life because of “leverage” headlines is how people overextend.
The “act” case: waiting is also a bet — one that rates fall before competition returns. Today’s leverage exists precisely because rates keep buyers away; the moment financing cheapens, the crowd comes back, bidding wars revive, and the below-list bargains vanish. Buyers who can genuinely afford today’s payments are negotiating against motivated sellers with little competition — a combination the market hasn’t offered in years. And a fixed rate isn’t forever: refinancing later is possible, while a purchase price is locked in permanently.
Both sides agree on the honest ground rules: the decision turns on personal finances, local conditions, and time horizon — not national headlines. And both watch the same dials: mortgage rates, inventory, and how long listings sit.
Difficult words, made simple
| Term | Plain-English meaning |
|---|---|
| Affordability index | 100 = a median family can just qualify for a median home; higher is easier. Overall: 105. First-timers: 70 |
| Mortgage rate | The price of borrowing the money — currently ~6.5-6.7% on a 30-year loan |
| Principal & interest | The core of a monthly payment: repaying the loan plus the cost of the money |
| Bidding war | Multiple buyers competing above asking price — the pandemic norm, now largely reversed |
| List price vs sale price | What the seller asks vs what the buyer pays; typical homes now close below list |
| Inventory | Homes actively for sale — about 1.2 million, up 3.2% in a year |
| Days on market | How long a listing sits — the longer it lingers, the weaker the seller’s hand |
| Buyer’s / seller’s market | Shorthand for who holds the negotiating power |
| Housing starts | New homes beginning construction — a key gauge of future supply |
| Home equity | The slice of a home’s value the owner actually owns — most families’ biggest asset |
The big takeaway
America’s housing problem is not one problem but two, stacked. Prices were set during a once-in-a-generation frenzy and never came down; the money to buy them then doubled in cost and stayed there. Squeezed between stubborn sellers and sticky rates, an entire cohort of first-time buyers — index reading: 70 — is locked outside the door.
And yet inside that frozen market, the balance of power has quietly moved. Homes sell below list. Inventory is rebuilding. Sellers who wait 18 weeks take a discount. The paradox resolves once you see it clearly: the market is unaffordable to enter, but negotiable once you’re in.
Three things worth watching from here: mortgage rates (which ultimately trace back to inflation, the Fed, and Treasury yields — the threads from our debt and Jackson Hole explainers); inventory growth (each month of rebuilding supply tilts power further toward buyers); and the first-time buyer index (the single best gauge of whether the door to ownership is reopening). Until that last number climbs back toward 100, the defining economic fact for millions of households will remain the same: the house didn’t change — the money did.
New to economics? Start with What Is an Economy? — then read the Jackson Hole explainer and America’s $40 Trillion Debt to see exactly where mortgage rates come from.
Sources
This article synthesizes reporting and analysis from U.S. Bank, The National Desk, and TheStreet:
• U.S. Bank: The impact of today’s interest rates on the housing market
• The National Desk: Housing market cools, but affordability remains out of reach for many
• TheStreet: Realtor.com divulges housing market, home price shift
• TheStreet: Americans face major decision after housing market news
All figures are drawn from those reports and the sources cited within them, including the National Association of Realtors, Realtor.com, Freddie Mac, and the NAHB. The monthly-payment comparison is illustrative arithmetic for a $400,000 loan, before taxes and insurance. This article describes the debate between waiting and buying without recommending either — housing decisions depend on personal circumstances. This is general information, not financial advice.
Growmmunity publishes explanations, not financial advice.
1 thought on “Why Is Housing So Expensive? The $850-a-Month Hidden Cost”