
What Is CPI? The Inflation Number That Decides the Fed’s Next Move
What is CPI? It’s the closest thing the economy has to a monthly report card on the cost of living — and on Friday, September 11, at 8:30 a.m. sharp, the next one lands with unusual weight. Wall Street, in Fortune’s phrase, is on edge; one analysis calls it the data that will decide the Fed’s September move.
Here’s the setup. The latest jobs report shocked everyone with +162,000 jobs — three times expectations — telling the Federal Reserve the economy can handle tighter policy (we walked through that report line by line). Now comes the other half of the Fed’s homework: Thursday, September 10, brings the Producer Price Index (PPI), and Friday, September 11, the Consumer Price Index (CPI) for August — the last major inflation readings before the Fed meets on September 15-16 to decide whether to raise interest rates. Markets currently price the odds of a hike around 55-60%; a hot CPI could push that well above 70%.
This guide is the missing manual: what the CPI actually is, how a single number gets assembled from a nation’s shopping carts, the crucial difference between “headline” and “core,” why this particular release matters so much — and how to read it yourself. In plain English. (New to economics? Start with What Is an Economy? and Inflation Explained — this article is the sequel that shows how inflation gets measured.)
First: what is the CPI, actually?
The Consumer Price Index, published monthly by the US Bureau of Labor Statistics, measures the change in prices paid by consumers for goods and services — tracking the spending patterns of urban consumers, a group covering more than 90% of the US population.
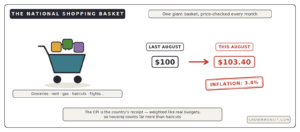
The easiest way to picture it: imagine one gigantic national shopping basket containing a sample of everything Americans actually buy — groceries, rent, gasoline, furniture, clothing, haircuts, car repairs, restaurant meals, plane tickets. Every month, government price-checkers record what that same basket costs. If the basket cost $100 last August and $103.40 this August, inflation is running at 3.4% — which is roughly where the headline number stood in the last report.
Two reading rules beginners need immediately:
Year-over-year vs month-over-month. The famous number (3.4%) compares prices to a year ago. But professionals watch the monthly change just as closely — it shows where inflation is heading right now, without old data dragging on the average.
The basket is weighted. Housing counts far more than haircuts, because that’s how real budgets work. This is also why the CPI never perfectly matches your inflation: your personal basket — your rent, your commute, your diet — is weighted differently from the national average. The CPI is the country’s receipt, not yours.
Headline vs core: the two-number trick
Every CPI report actually delivers two stars, and the gap between them is where the story usually lives.
Headline CPI is the whole basket. Last report: 3.4% year-over-year, down a touch from 3.5%.
Core CPI strips out food and energy. Last report: 2.5%, down from 2.6% — much closer to the Fed’s 2% target.
Why on earth would anyone exclude food and gas — the two things everyone buys? Not because they don’t matter, but because they swing violently for reasons that have little to do with the underlying economy: a war, a hurricane, an OPEC meeting. Core is the attempt to hear the signal under that noise — the slow-moving inflation embedded in rents, services, and wages that the Fed can actually influence. A useful analogy: headline is today’s weather; core is the climate.
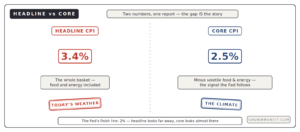
And right now the two are telling different stories: headline at 3.4% looks stubbornly far from 2%, while core at 2.5% looks almost tamed. Which one you emphasise basically determines which side of the rate debate you land on — hold that thought.
Why this CPI release is unusually heavy
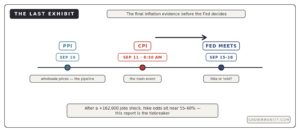
1. It’s the last word before the Fed decides. The September 15-16 meeting comes just days after the release, and this CPI (plus the PPI a day earlier) is the final major evidence. After Jackson Hole — where Chair Warsh warned “we have work to do” — and after the blowout jobs number, the Fed has cover to hike if inflation looks hot.
2. The oil complication. Energy prices have surged again as the Middle East conflict keeps oil near $91 — a fresh source of inflationary pressure that could push headline CPI up even if the underlying economy is cooling. The report will show how much war-driven energy is bleeding into everything else — exactly the transmission chain we drew in the oil explainer.
3. Markets have pre-committed, again. As with the jobs report, trillions are positioned around forecasts, so the surprise — not the level — moves markets. One analysis lays out the scenarios plainly:
| If the CPI comes in… | Likely market reaction |
|---|---|
| Hot (above forecasts) | Hike odds jump well above 70% — a September hike becomes the overwhelming expectation |
| In line with forecasts | Odds hover around 55-60% — the Fed’s call comes down to details and judgment |
| Soft (especially monthly core below 0.2%) | Investors reassess the need for a hike — relief for stocks and bonds |
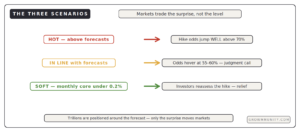
If that “trade the surprise” logic sounds familiar, it should — it’s the same probability machinery from the jobs report and the Fed explainer. CPI is simply the third dial on the same dashboard.
Thursday’s warm-up act: what is PPI?
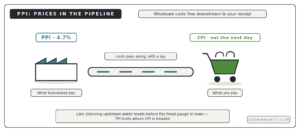
One more tool for your kit. The Producer Price Index, out the day before CPI, measures prices at the wholesale level — what businesses pay before, as Fortune puts it, they pass along the costs to consumers. Think of PPI as prices in the pipeline: if producers’ costs are accelerating (last reading: 4.7% year-over-year, down from 5.5%), some of that pressure usually reaches store shelves — and the CPI — in the months ahead. Reading PPI before CPI is like checking upstream water levels before the flood gauge in town.
(For completeness: the Fed’s officially preferred gauge is a cousin called PCE, published weeks later — but markets react hardest to CPI because it arrives first and matches what consumers actually see.)
Two honest views: hike or hold?
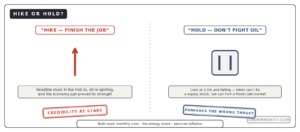
The “hike” case: headline inflation has been stuck in the mid-3s — far above the 2% promise — for long enough to threaten the Fed’s credibility, war-driven energy is re-igniting price pressure, and the economy just proved its strength with a +162,000 jobs month. Waiting risks repeating the classic error: letting inflation re-anchor higher because tightening felt uncomfortable.
The “hold” case: core inflation — the part the Fed can actually control — sits at 2.5% and falling; the energy spike is a supply shock that rate hikes can’t fix and that may fade as fast as it arrived; and beneath the headline jobs number, the labour market is a low-hire, low-fire freeze with slipping participation. Hiking into that, to fight oil prices, punishes borrowers without touching the cause.
Both camps will read the same three lines in the report: monthly core CPI (below 0.2% changes everything), how much of any rise is pure energy, and services inflation — the stickiest part of the basket.
Difficult words, made simple
| Term | Plain-English meaning |
|---|---|
| CPI | The Consumer Price Index — the monthly cost of the national shopping basket |
| Headline CPI | The whole basket, food and energy included — currently ~3.4% |
| Core CPI | The basket minus volatile food and energy — currently ~2.5%; the Fed’s signal |
| Year-over-year vs monthly | Prices vs last year (the famous number) vs last month (the fresh direction) |
| The 2% target | The Fed’s definition of price stability — the finish line every report is judged against |
| Basket weights | Housing counts more than haircuts — why national CPI ≠ your personal inflation |
| PPI | Producer Price Index — wholesale prices in the pipeline, out the day before |
| PCE | The Fed’s preferred inflation gauge, published later — CPI’s quieter cousin |
| BLS | The Bureau of Labor Statistics — the agency doing the nation’s price-checking |
| Priced in | Already reflected in markets — only the surprise moves prices |
The big takeaway
The CPI is nothing more mysterious than the country’s collective receipt, checked monthly against the same giant basket — and nothing less important than the number that steers the Fed, the bond market, and every borrowing cost in your life. On September 11, that receipt arrives as the final exhibit before a rate decision the markets themselves rate as a coin flip leaning toward a hike.
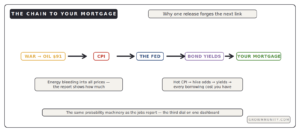
Three tools worth keeping. First, always read both numbers — headline for what people feel, core for what the Fed follows; right now they point in different directions, which is the debate. Second, watch the monthly core figure — below 0.2% cools the hike talk; above it, the +162,000 jobs report plus hot prices makes September’s hike hard to stop. Third, remember the chain: war → oil → CPI → Fed → bond yields → your mortgage. At 8:30 a.m. on September 11, the next link gets forged.
New to economics? Start with What Is an Economy? — then read Inflation Explained, the Jobs Report guide, and the Jackson Hole explainer — together they’re the full dashboard for Fed week.
Sources
This article synthesizes reporting and analysis from Investing.com, Fortune, and the US Bureau of Labor Statistics:
• Investing.com: US Inflation Data Set to Decide the Fed’s September Move
• Fortune: Upcoming inflation data could determine if the Federal Reserve hikes interest rates soon
• US Bureau of Labor Statistics: Consumer Price Index Summary
All figures are drawn from those sources; scenario probabilities are the analysts’ estimates as of publication and shift with each data point. Background: Consumer price index. This article explains how to read the data and presents both policy views without endorsing either. This is general information, not financial advice.
Growmmunity publishes explanations, not financial advice.
1 thought on “What Is CPI? The Inflation Number That Decides the Fed’s Next Move”